National Tsunami Warning Center, NOAA/NWS
TSUNAMI of 13 June, 2013 (Northwestern Atlantic Ocean)
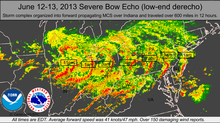
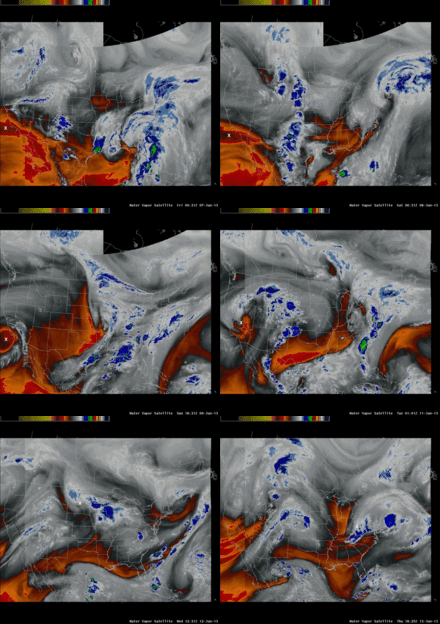
Tsunami-like waves were observed along the US east coast during the afternoon of June 13, 2013 (day 164). The source is complex and still under review, though the coincidence at several gages with strong atmospheric pressure fluctuations indicate that it is at least partly generated by meteorological causes. The event occurred in close conjunction with a weather system labeled by the National Weather Service as a low-end derecho which propagated from west to east over the New Jersey shore just before the tsunami. The tsunami was observed at over 30 tide gages and one DART buoy throughout the Northwestern Atlantic Ocean.
A first-hand description was provided by Brian Coen who observed the event at Barnegat Inlet in New Jersey:
Around 3:30pm on Thursday June 13, 2013, Brian Coen was spear fishing near the mouth of Barnegat Inlet;
just south of the submerged northern breakwater. Earlier in the day around noon, thunderstorms had moved
through the area. By 3:30pm the weather was overcast with a light east wind. At approximately 3:30,
the outgoing tide was amplified by strong currents which carried divers over the submerged breakwater (normally 3-4 feet deep).
This strong outrush continued for 1-2 minutes and eventually the rocks in the submerged breakwater were exposed.
Brian backed his boat out before being sucked over as well.
At this point, Brian noticed a large wave coming in, approximately
6 feet peak-to-trough and spanning across the inlet. The upper 2 feet of the wave was breaking.
This wave occurred in conjunction with a reversal of the current such that even though the tide was going out,
a strong surge was entering the inlet. This surge carried the divers back over the submerged reef and into the
inlet from where they were picked up. On the south jetty three people were swept off the rocks which were 5 to 6 feet
above sea level at the time. At least two were injured requiring medical treatment. There was no more strong activity after about 5 minutes.
This event produced a tsunami that was
recorded at tide gages monitored by the National Tsunami Warning Center (NTWC).
Many observatories provide data to the centers; such as the NOAA National Ocean Service, the U. of
Hawaii Sea Level Center, the Chilean Navy, the Japan Meteorological Agency and the National Tidal Facility in Australia among others.
Click on the site name to see a graph of the tsunami, when available. Listed wave heights are maximum
amplitude in cm (above sea level). Observed Arrival time is the actual tsunami arrival time in UTC on
gages where it could be determined. The Sample Interval column shows
the time between data samples.
Coastal Observations
|
Tide gage/ |
Estimated Arrival Time |
Observed Arrival time |
Peak amplitude |
Time of Peak Amplitude Measurement |
Model Forecast Amplitude |
Initial motion |
Sample Interval |
Data File |
|
- |
2300 (164) |
16 |
- |
- |
up |
1 |
||
|
- |
2105 (164) |
7 |
- |
- |
? |
1 |
||
|
- |
2127 (164) |
25 |
- |
- |
up |
1 |
||
|
- |
2130 (164) |
8 |
- |
- |
? |
1 |
||
|
- |
2000? 164) |
12 |
- |
- |
? |
1 |
||
|
- |
1458 (164) |
12 |
- |
- |
up |
1 |
||
|
- |
1504 (164) |
12 |
- |
- |
up |
1 |
||
|
- |
1806 (164) |
24 |
- |
- |
? |
1 |
||
|
- |
1954 (164) |
8 |
- |
- |
? |
1 |
||
|
- |
1958 (164) |
6 |
- |
- |
? |
1 |
||
|
- |
1850? (164) |
19 |
- |
- |
up |
1 |
||
|
- |
1520? (164) |
10 |
- |
- |
? |
1 |
||
|
- |
1732? (164) |
11 |
- |
- |
? |
1 |
||
|
- |
1820? (164) |
26 |
- |
- |
up |
1 |
||
|
- |
2012 (164) |
23 |
- |
- |
up |
1 |
||
|
- |
1845 (164) |
12 |
- |
- |
up |
1 |
||
|
- |
1937 (164) |
10 |
- |
- |
up |
1 |
||
|
- |
1949 (164) |
10 |
- |
- |
up |
1 |
||
|
- |
1923 (164) |
22 |
- |
- |
? |
1 |
||
|
- |
1944? (164) |
9 |
- |
- |
? |
1 |
||
|
- |
2221(164) |
4 |
- |
- |
up |
1 |
||
|
- |
1655(164) |
4 |
- |
- |
up |
1 |
||
|
- |
- |
- |
- |
- |
- |
15 sec |
||
|
- |
- |
- |
- |
- |
- |
15 sec |
||
|
- |
- |
- |
- |
- |
- |
15 sec |
||
|
- |
- |
- |
- |
- |
- |
15 sec |
||
|
- |
1821(164) |
6 |
- |
- |
up |
1 |
||
|
- |
2040? (164) |
5 |
- |
- |
? |
1 |
||
|
- |
2020? (164) |
7 |
- |
- |
? |
1 |
Chesapeake Bay Observations
(Note: some sites had two well-defined starts as shown by the first in parenthesis).
|
Tide gage/ |
Estimated Arrival Time |
Observed Arrival time |
Peak amplitude |
Time of Peak Amplitude Measurement |
Model Forecast Amplitude |
Initial motion |
Sample Interval |
Data File |
|
- |
(1300?)/2107? (164) |
(4)/5 |
- |
- |
? |
1 |
||
|
- |
(1312)/2030 (164) |
(4)/6 |
- |
- |
(up)/up |
1 |
||
|
- |
2000 (164) |
12 |
- |
- |
up |
1 |
||
|
- |
(1322)/2039 (164) |
(13)/9 |
- |
- |
(up)/up |
1 |
||
|
- |
2051? (164) |
4 |
- |
- |
up |
1 |
||
|
- |
2053 (164) |
12 |
- |
- |
up |
1 |
||
|
- |
2104 (164) |
10 |
- |
- |
up |
1 |
||
|
- |
2117 (164) |
7 |
- |
- |
up |
1 |
||
|
- |
2139 (164) |
17 |
- |
- |
up |
1 |
Questions and Answers about this Event
NOS Air Pressure Observations at certain Tide Gages
Summarized Sea Level Observations


 Twitter
 Facebook
 YouTube
