National Tsunami Warning Center, NOAA/NWS
MeteoTsunami of 15 May, 2018
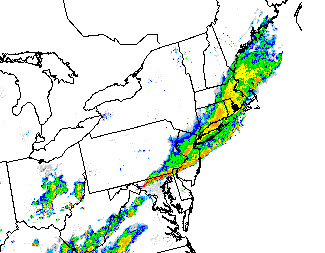
A large-scale squall line of severe thunderstorms, or derecho, raced through parts of the Northeast on May 15, 2018. The storm system stretched 470 miles
from western Pennsylvania to southern New England to Maryland and persisted over approximately eight hours, beginning around midday and continuing
through early evening. The powerful storm caused extensive wind damage, hail, and also produced nine tornadoes in Connecticut, New York, and Pennsylvania.
As the storm tracked southeast across southern Connecticut and Long Island (~2100-2300 UTC May 15th), 3 to 5.5mb pressure rises in 5 to 20 minutes were
observed. Weather-induced wave activity was observed locally on the tide gauges in Long Island Sound. The storm also generated a small meteotsunami off
the Long Island/New Jersey coastline which was measured (4cm) on the deep ocean DART buoy at 2330 UTC May 15. The storm front then moved south across
Maryland and Southern New Jersey (2300UTC May 15 to 0400 UTC May 16), slowing as it did so. Pressure rises were on the order of 1-2mb in 20-40 minutes.
Weather-induced wave activity was observed locally on the tide gauges in Chesapeake Bay as persistent southwesterly winds (up the bay) ahead of the storm
front abruptly shifted to northerly.
Many observatories provide data to the Tsunami Warning centers; such as the NOAA National Ocean Service, the U. of
Hawaii Sea Level Center, the Chilean Navy, the Japan Meteorological Agency and the National Tidal Facility in Australia among others.
Click on the site name to see a graph of the tsunami, when available. Listed wave heights are maximum
amplitude in cm (above sea level). Observed Arrival time is the actual tsunami arrival time in UTC on
gages where it could be determined. The Sample Interval column shows the time between data samples.
|
|
|
Tide gage/ |
Estimated Arrival Time |
Observed Arrival time |
Peak amplitude |
Time of Peak Amplitude Measurement |
Model Forecast Amplitude |
Initial motion |
Sample Interval |
Data File |
|
- |
- |
6 |
0156 (136) |
- |
? |
1 |
||
|
- |
- |
15 |
0023 (136) |
- |
? |
1 |
||
|
- |
- |
8 |
0140 (136) |
- |
? |
1 |
||
|
- |
- |
8 |
0335 (136) |
- |
? |
1 |
||
|
- |
- |
14 |
2302 (135) |
- |
? |
1 |
||
|
- |
- |
7 |
0239 (136) |
- |
? |
1 |
||
|
- |
- |
13 |
2157 (135) |
- |
? |
1 |
||
|
- |
- |
19 |
0208 (136) |
- |
? |
1 |
||
|
- |
- |
22 |
0056 (136) |
- |
? |
1 |


 Twitter
 Facebook
 YouTube